For the last few weeks I’ve been working a problem with a few of my teammates on front-end web performance. I use the term problem in the general sense. It’s not like we have a “performance” problem from the responsiveness perspective. Rather, it’s that we need to do a better job measuring front-end performance as part of our Continuous Delivery goals and objectives. As we attempt to make our product more responsive, modern and ubiquitous from a browser perspective, our product needs to be fast if not near instantaneous.
Our visibility is unnecessarily limited. We have ample opportunities to measure front-end performance. Rather rest on our laurels, we need to plug away at the data and make something happen to better “capture, analyze and act” to quote my good friend and teammate, Mike McGarr.
So for the last few weeks I’ve been working with a couple of teammates exploring how we could make use of HAR files. If you are unfamiliar with HAR (HTTP Archive), it’s a specification to encapsulate network, object and page requests over HTTP as an exportable format. The format is JSON and it has become the de facto standard for measuring and capturing web performance timings.
Over the years my team has made ample use of the data that can be exported in the HAR. We’ve used tools like Fiddler, YSlow, HTTPWatch, Firebug, Chrome Developer and WebPageTest to capture page waterfalls, CSS/JS behaviors and object timings. Much of that analysis happens real time in the tools/proxies that capture that information. Nearly all of the analysis was individual request driven, meaning that we studied individual pages by themselves and not via a time-series view. When a performance optimization was made, we did compare before/after. That was done in a fairly analog method by hand.
What we decided to do was look at this problem of HAR analysis in a more scientific, programmatic and analytical way. We have this massive library of Selenium automation that exercises almost 80% of the UI functionality within our product. It’s quite remarkable the coverage considering the size of our product. We have been prototyping BrowserMob sitting between our SUTs (System Under Test) and our Selenium scripts which we execute via the Fitnesse framework. With BrowserMob we can capture most if not all of the critical HAR information in a JSON format. From there, we are moving the JSON object into a JSON compliant file store.
We are considering a variety of stores for now, with the obvious candidates being Postgres, MongoDB and Redis. Our goal is to archive these JSON files and then be able to analyze the contents in both a vertical (within a JSON file) and horizontal (across many JSON files) with relative ease. We want to be able to study/measure regression continuously, as well as alert/fail builds when conditions or criteria of object/page responsiveness is violated.
It seems simple in nature, but in actuality it’s kind of a tough task. While there is the HTTP Archive (http://httparchive.org/) which does some high-level stats, I can’t for the life of me find anything that’s been built that looks to programmatically evaluate HARs from both a micro and macro perspective, as well as over time-series (iterations and improvements…or worst with degradations). So right now that’s something we are looking to build. It could give us some very powerful data as we capture, analyze and act on the data. Once we have something, look for us to put it on our GitHub site so others can fork or extend.
There’s no reason for us to necessarily wait for this kind of data that may be obtainable in a different format. Back in May, I stumbled upon a took called Piwik. At the time I posted a quick Tweet to see if any of my friends in the Performance or DevOps community were familiar with it. Nobody ever responded or retweeted. The folks at Piwik didn’t even give me props, which is fine. I’m not in the Twitter game for props. Basically, I posted the tweet and then dropped it from memory.
Just yesterday, a few of my teammates were fortunate to get on a conference call with a client of ours named Terry Patterson. He’s a really knowledgeable Blackboard SME and even wrote a book about how to be a successful Blackboard System Administrator. I’ve read it and I have to say that I’m quite impressed with what he put together. I’m not really certain about the purpose of the call, but one of the outputs of the call was that Terry shared his implementation of Piwik to my teammates.
Years ago we did a proof of concept getting our product to seamlessly integrate with Google Analytics. We even introduced a simple template to inject the JavaScript into our googleAnalyticsSnippet.vm file that we store under our shared content directory. To make use of Pikwik, you leverage the configuration we enabled for Google Analytics. The exact location can vary from system to system depending on the shared content, but basically it can be found under $BLACKBOARD_HOME/$SHARED_CONTENT/web_analytics/googleAnalyticsSnippet.vm. Simply modify this file with the JavaScript source that should be used for Google Analytics. It’s basically the same thing. I’ve pasted an example below which references my localhost for the server.
<!– Piwik –>
<script type=”text/javascript”>
var _paq = _paq || [];
_paq.push([‘trackPageView’]);
_paq.push([‘enableLinkTracking’]);
(function() {
var u=((“https:” == document.location.protocol) ? “https” : “http”) + “://localhost//”;
_paq.push([‘setTrackerUrl’, u+’piwik.php’]);
_paq.push([‘setSiteId’, 1]);
var d=document, g=d.createElement(‘script’), s=d.getElementsByTagName(‘script’)[0]; g.type=’text/javascript’;
g.defer=true; g.async=true; g.src=u+’piwik.js’; s.parentNode.insertBefore(g,s);
})();
</script>
<noscript><p><img src=”http://localhost/piwik.php?idsite=1” style=”border:0″ alt=”” /></p></noscript>
<!– End Piwik Code –>
You also can modify the velocity.properties file under $BLACKBOARD_HOM/config/internal to change the modificationCheckInterval from 12 hours down to let’s say 60 seconds. Note that the parameters is in seconds. So simply change the default parameter which is 43200 seconds (12 hours) to 60. Simply restart your server instance and it will start sending information to the Piwik server in seconds.
This is great and very powerful information. Every customer should leverage this powerful data. The question that is going through my mind is how can we leverage this information within our test laboratories? Of course it would be amazing to have this deployed in most if not all of our customer’s environments. Having client data would be invaluable. Having a way to analyze our own test data can be just as meaningful.
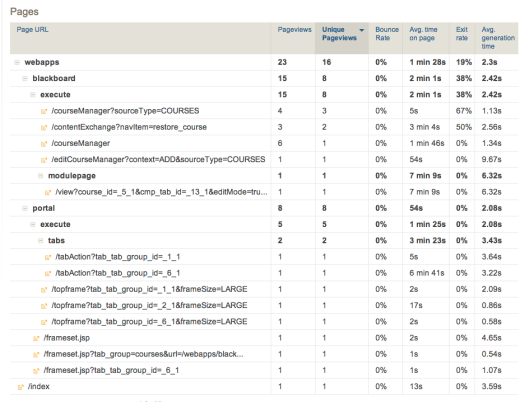
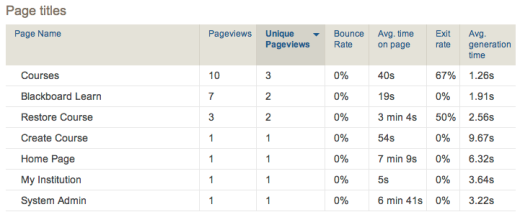
First, I see us leveraging the performance data that comes from generation time of a page (initiation of the request to full DOM rendering). This data is pretty clean from a mapping of pages in our product to business/functional purpose. We could capture this data from our automation tests and perform regression analysis from build to build and over time.
This makes me think about our LoadRunner library. Over the years we have created naming conventions for transactions. Looking at how our product has evolved and how pages are named with relative ease from the markup. We might as well consider capturing the transaction from the page name. It’s like mapping Business Transactions from a dynaTrace, New Relic or AppDynamics perspective. Looking back on it, we created a naming convention because at the time none existed that was consistent and uniform, but for years the names of pages have been meaningful. We simply didn’t adapt.
Second, we could compare this data with the HAR data to validate complete page timings. The HAR data will give us page/object level timings, whereas Piwik gives us full page generation timings. Remember that web analytics isn’t really a goal from a testing perspective. All of my load will come from automated SUTs from the same data center. I will see browser variation, but that’s known since we control the automation engine. So my point is that we can see page load behavior from two perspectives.
It’s pretty clear from the randomness of this blog that I still have a lot of thinking about the data. At a minimum, I think we should play around with Piwik both internally and externally to see what value we get. It may even make sense for my other teams like my DevOps group to consider incorporating this into our Confluence and JIRA environments as well.

